
Graph of a Logarithmic Function - Explanation
Video explanation
Explanation
The graph of a logarithmic function is a key tool in mathematics that visually represents the relationships between numbers in logarithmic form. A logarithmic function, which has the form y = log_a(x) (where 'a' is the base of the logarithm and 'x' is the argument), shows how the value of y changes as x changes.
BASICS OF THE LOGARITHMIC FUNCTION
The logarithmic function is the inverse of the exponential function. This means that if we have an exponential function y = a^x, then its inverse function is given by x = log_a(y). Logarithms measure how many times we must multiply the base 'a' by itself to get a certain number 'x'. (More precisely, log_a(x) is the exponent to which 'a' must be raised to get 'x').
CHARACTERISTICS OF THE GRAPH OF A LOGARITHMIC FUNCTION
The graph of a logarithmic function has several key characteristics:
- PASSES THROUGH THE POINT (1,0): Regardless of the base 'a', every graph of a logarithmic function will pass through the point (1,0), because log_a(1) = 0 for any valid base 'a'.
- VERTICAL ASYMPTOTE: The graph has a vertical asymptote at x = 0. This means the graph approaches but never crosses or touches the y-axis. This reflects the fact that the logarithm is not defined for x less than or equal to 0.
- INCREASING/DECREASING BEHAVIOR:
- If the base a > 1, the graph of the logarithmic function is always increasing for all x > 0. This means that as x increases, y also increases, though the rate of increase slows down as x gets larger.If 0 < a < 1, the graph is always decreasing for all x > 0.
UNDERSTANDING THE GRAPH
The graph of a logarithmic function allows for a better understanding of the properties of logarithms. For example, we can see how quickly or slowly the value of the logarithmic function changes depending on the base 'a' and the value of 'x'. This is particularly useful when solving equations and inequalities involving logarithms.
CONCLUSION
The graph of a logarithmic function is an important tool that enables students to visualize and understand complex mathematical concepts related to logarithms. With the help of these graphs, students can develop a deeper understanding of logarithmic functions and their use in various mathematical and practical contexts. Understanding how to read and analyze these graphs is a fundamental skill.
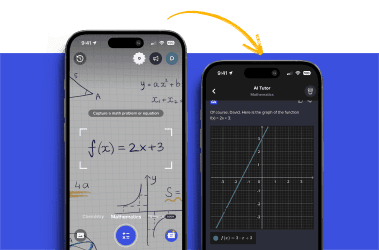


Take a picture of your assignment and use AI tutor.
- Function
- Linear Function
- Quadratic Function
- Inverse Function
- Power Function
- Exponential Function
- Logarithmic Function
- Exponential Equation